
The Biggest-Ever Short on TY 10Yr Futures: The Tale of Two Reports
You know it’s a quiet week when the CFTC report makes it on to Bloomberg with reports that hedge funds have their biggest ever short on TY 10Yr futures.
But is it really the biggest ever short?
The disaggregated reports splits trading between dealers, asset managers and leveraged money. Figure 1 below shows the disaggregated net positions in TY futures with the leveraged money short clear to see.
The problem is you could equally shout from the roof tops about the asset manager long. That’s the issue with the disaggregated data – it pretty much always shows asset managers and leveraged money as having (almost) equal and opposite positions.
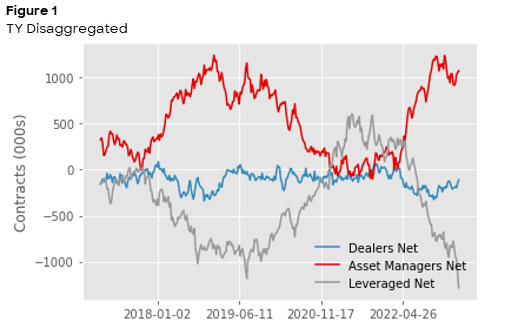
Source: CFTC
If you look at Figure 2 you can see that’s not just the case in TY, but in all the fixed income contracts.
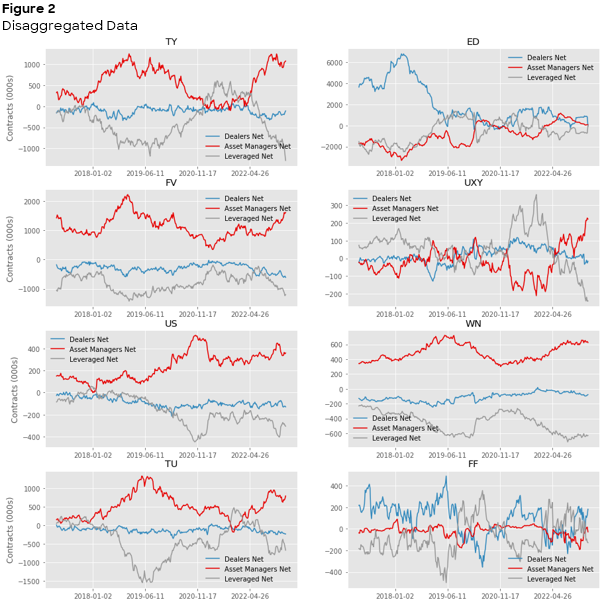
Source: CFTC
The use of the term “leveraged money” inherently implies some speculative element. The problem is the disaggregated report doesn’t split between the two, and the non-speculative element of the market is huge.
The Commitment of Traders report splits between commercial and non-commercial traders, with commercial users being those that trade futures mostly for hedging purposes. Figure 3 plots the ratio between the two groups’ gross exposure over time.
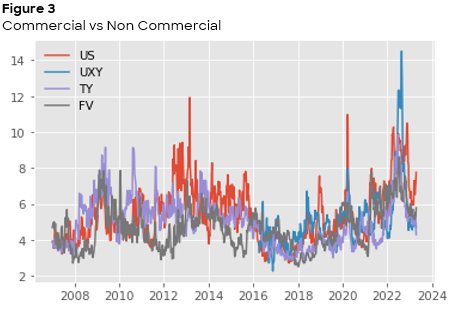
Source: CFTC
Commercial volume is typically between four and six times the size of speculative volume, and often much larger. If you are looking at data which merges the two, such as the disaggregated report, commercial activity dwarfs everything so you need to be aware that an apparent position does not imply a directional exposure.
That’s not to take away from the scale of the short, just to point out you should be looking in the right place and can’t always distinguish between client types.
We noted last week the long end short has bounced back quickly and it has grown again this week with decent non-commercial selling of TY futures, reflecting a pick-up in gross shorts. It’s still a little short of the peak reached in 2018 but still, it is clearly a dominant position.
Written by Mike du Plessis, Head of Listed Derivatives, and Darren Smith, Head of EQS Listed Derivatives
The information provided by Liquidnet is not investment advice nor is it intended as a recommendation to buy, sell or hold any instrument referenced. Any analysis provided is not sufficient upon which to base an investment decision. A recipient should consider its own financial situation and investment objectives and seek independent advice, where appropriate, before making any investment. Although the statements provided by Liquidnet are believed to be correct, they have not been verified and should not be relied upon when considering the merits of any particular investment. All presented data may be subject to slight variations.
The information provided by Liquidnet is for institutional investor use and is intended for the recipient only. Any disclosure, reproduction, distribution or other use of the message or any information generated by the product by an individual or entity other than the intended recipients prohibited. Please contact your Liquidnet coverage for more information about any of the information and analysis provided herein.