
Mid-Year Review: Improved Equities Trading Conditions Are Asking for Conviction
As we await word from the SEC, let’s focus on some current market dynamics, i.e., source of volumes, continuous market volume, impact costs, depth, correlations, volatility, etc. And on behalf of all the comment letters submitted to the SEC in the condensed comment period, we’ll quote the great English rock band Pink Floyd: Is there anybody in there? Just nod if you can hear me. Is there anyone home? Come on now. […] A distant ship smoke on the horizon.
Let’s dive in.
Lately, attention seems to be on improving liquidity conditions and it is always important to understand the source of market liquidity.
From an institutional perspective, much of the pattern of retail flows following equity performance don’t add much in terms of available liquidity, but some things have noticeably improved for traders and portfolio managers including book depth, lower correlations, and reduced volatility. The retail army has a high incidence of following equity performance . This is a pattern going back to the beginning of 2021, which really showed up in 2022. With overall pressure on equities over the course of the year, a number of valleys presented opportunities with double-digit percentage gains to follow and with it, the noticeable shift from on to off-exchange executions.
The retail was once again in the driver’s seat.
It is never a perfect barometer extrapolating the exact retail contribution to market volumes. While not at the peaks of early 2021 — which was at times +25% — it is safe to say that the range runs from a percentage in the low teens when the market is reeling to high teens when the market is rising, such as now. Remember, it isn’t just the esoteric penny stocks, it happens in heavy institutional names—particularly when market leadership has been as narrow as it has and when a high percentage of volume is retail-rooted in a position. Trading costs tend to go up.
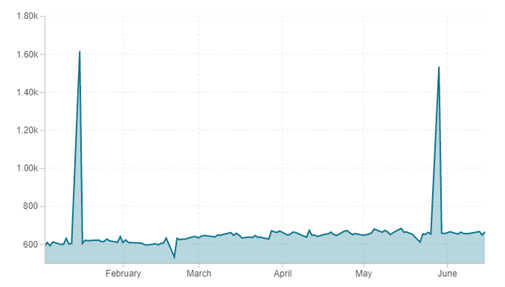
J.P. Morgan cited the biggest retail flows on record last week, with non-professional investors buying $1.5B of single stocks, including ETFs and it totaled $4.4B worth of purchasing.
Figure 1: Weekly Retail Order Flow ($M), July 2022 - June 2023

Source: J.P. Morgan
While market leadership is narrow, the FOMO trade from the institutions becomes more pronounced. Bloomberg cites that 43% of the S&P 500 gains this year can be accounted for by three names: Tesla, Apple, and Nvidia. Options activity, however, doesn’t ebb and flow like equity volume.
The shift to off-exchange
H1 was also marked by a rise in off-exchange activity driven by retail activity. As shown in Figure 2 below, the FINRA TRF reported (off-exchange) volumes coincided with the bear market rallies of 2022 (S&P 500)—late February to late March at 7%, mid-June to mid-August at 17%, and mid-October to mid-December at 10%.
The payment for order flow structure was at work as wholesalers consume more flow from retail brokers. Volume is consumed into the wholesaler risk book and therefore becomes vapor volume the institutional community typically never sees (or at least until that position is exhausted out and likely more piecemeal). Each of the periods coincided with a sharp shift to off-exchange reported volumes.
Figure 2: TRF Volume, January 2022 - December 2022

Source: Liquidnet
Not shockingly, the last six months have sustained a high 43% of total market volume off-exchange. This is a 200bp jump from the average of 2022 with retail following performance.
Figure 3: Weekly Retail Order Flow ($M), July 2022 - June 2023

Source: Liquidnet
Correlations made for a tough liquidity environment
Mentioned above, correlations made a strong move lower. From an individual stock pricing perspective, the tenaciously high correlations of 2022 and into Q1 of 2023 made it a difficult environment.
The lock-step nature of the market not only hit levels seen only a handful of times in the last 20 years but plateaued for the longest period the data shows.
Correlational extremes tend to be much shorter lived and speak to the severity of the headwinds and macro uncertainty. Institutions also spent much of 2022 in a mass de-risk as cash levels rose to generational levels, all of which impacts liquidity.
More on liquidity below, including some signs of improving, but keep in mind that correlations have reverted hard. While that makes stock picking a more friendly backdrop, risk is also on the rise.
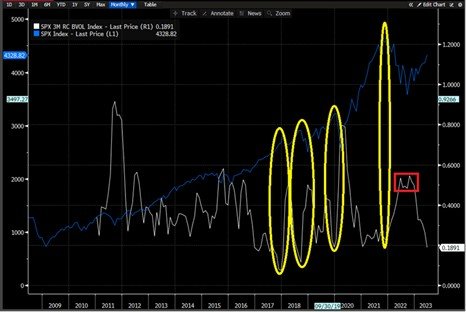
Peaks often precede rallies, such as the current one, and valleys often precede weakness. Figure 4 below is a longer term chart of the SPX 3M realized correlation overlaid on the SPX. The longer term trajectory of prices is obvious but highlighted in yellow are some of the correlation valleys preceding a market pull-back. Boxed in red is the rare sustained position of 2022 into 2023.
Figure 4: SPX 3M Realized Correlation Overlaid on the SPX, 2009-2023
Source: Bloomberg
(Still-poor-but-somewhat-improving) Liquidity Conditions
From most perspectives, liquidity is poor. High correlations and high cash-raise created a liquidity vacuum for the past year and a half with trading costs, real price volatility, low depth of book, etc., all contributing factors.
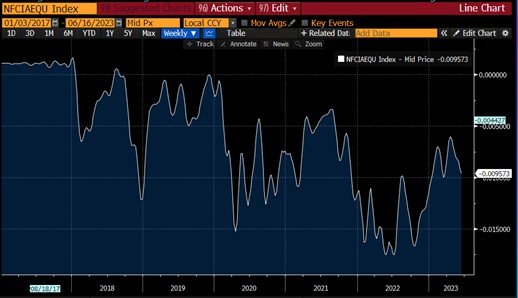
Bloomberg strategist Cameron Crise recently pointed to a liquidity model/measure of
S&P 500 liquidity. While low vs. historical, there are some signs of improvement to go along with the rally of this year. Overall market volumes were 13% higher through this period last year, but better liquidity points to better conviction and conditions would warrant as well. Discounting the macro, bull vs. bear tug of war—yield curve indicating recession, higher for longer
Federal Open Market Committee (FOMC) messages, overbought (Nasdaq 100 touching 25% above 200-day moving average, equaling historical precedence of 4% of the time), stretched sentiment/positioning, elevated growth versus disinflation, soft landing, FOMC pause/pivot—it all totals to quite the battle.
Figure 5: Improving but Still Poor: Stock Market Liquidity Remains Well Below Average

Source: Bloomberg
The improved liquidity, however, may be confined to large caps. See Top of Book liquidity below (Figures 6 and 7), where the top 500 is much improved. Again, not at historical levels, but nearing three-year highs. While the small and mid-cap space sees a much more gradual improvement and does not depict notably improving conditions.
Figure 6: Liquidity (Top of Book Shares), July 2022 - June 2023

Source: Liquidnet
Figure 7: Liquidity (Top of Book Shares), Jan. 2023 - June 2023
Source: Liquidnet
Figure 10 illustrates the drying liquidity as measured by E-mini depth and extreme lows over the course of 2022. While the two-sided notional is still not attractive when compared with pre-Covid, below shows a broad CME E-mini contract on weighted averages of financial activity, where depth is sharply improved from the lows.
Figure 8: Drying Liquidity as Measured by E-Depth, January 2017 - June 2023
Source: Bloomberg
Real price volatility and the VIX conversation
Real price volatility is showing signs of abating as well. There were a lot of discussions over the course of 2022 as the VIX gauge disconnected from the real fear in the marketplace.
There is a confluence of answers as to why the VIX became somewhat irrelevant — bearish/bullish positioning around FOMO trades, cash levels at 20-year highs diminishing net demand for protection, opaque macro-economic signals leaving interpretations mixed, institutions buying bullish call options as short hedges while retail sells bearish puts as directional bets (both groups betting on the same macro condition but options strategies cancel each other out, movement to short-dated options for directional bets, etc.). 5
While the VIX was rangebound and inexplicably low, the real price volatility was rivaled in sustainability only by the GFC 2007-2009. But again, the real price volatility is declining. This greatly diminishes the intraday trading fear of a price in time, i.e., adverse selection.
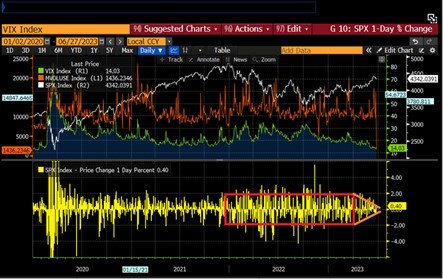
The yellow bar chart on the bottom of Figure 11 shows daily move in either direction of the S&P 500. Although noisy on such a long dated data set, there is a flurry of intraday misdirections, which was extremely strong in 2022. Some pockets, like the initial Covid descension on the world was more violent but there was a quick reversion relative to 2022. In terms of staying power, price volatility was strong during the GFC. Choppiness, along with declining liquidity makes trading a cowboy endeavor, so to speak.
Figure 9: VIX Index, January 2007 - January 2023

Source: Bloomberg
Figure 10 is a shorter term chart that illustrates declining tendencies in terms of real price volatility and aligns with the theme of improving conditions.
Figure 10: VIX Index, January 2020 - June 2023
Source: Bloomberg
The VIX was rangebound all throughout 2022 with the S&P dropping 4.3% on one day in September 2022—the single worst day move ever with a VIX below 30. Now in the last few weeks it’s establishing an even lower range.
Although not quite reflective of the aforementioned bull/bear tug of war, lower volatility represents a digestion of sorts of the FOMC message pivot and the offsetting bearish concerns. The simple act of the S&P 500 opening and closing on the same price is a recent rarity—this has happened nine times since the beginning of April 2023 (if not on the nose, then 1-2 points off).
Figure 11: VIX Index, December 2019 - June 2023

Source: Bloomberg
Overbought/Oversold Conditions
While there seems to be conflicting strategist calls on value and direction, it is worth looking at overbought/oversold conditions, which are most commonly monitored through the RSI. Looking at some of the major indexes, the message is far from extreme.
Figure 12: RSI Summary, June 26, 2023

Source: Liquidnet
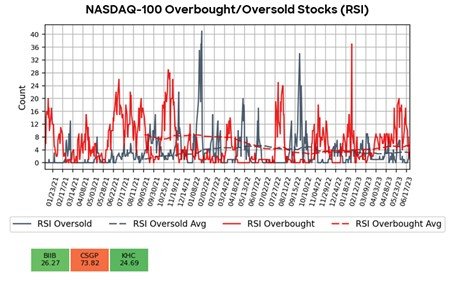
As mentioned previously, while the Nasdaq 100 sits alarmingly above the 200-day moving average, the number of names actually overbought is below averages.
Figure 13: Nasdaq 100 Overbought/Oversold Stocks 9RSI), January 2021 - June 2023
Source: Liquidnet
The S&P 500 is far from the overbought highs seen in February 2023 and July 2022.
Figure 14: S&P 500 Overbought/Oversold Stocks (RSI), January 2021 - June 2023

Source: Liquidnet
Figure 15: Russell 2000 Overbought/Oversold Stocks (RSI)

Source: Liquidnet
Conditions are not great but there are certainly some signs of improvement. Trading is forming uneventful patterns, which may be welcome news to the institutional community. That said, some portfolio managers and traders also wouldn’t be shocked if this market was down 10% between now and the end of September. As mentioned, risk is on the rise according to a realized correlation perspective but trading costs were down considerably from mid-2022.
Figure 16: Liquidnet Estimated Impact Cost on the top 500 Names

Source: Liquidnet
So what are the key takeaways from the first half of the year?
In short, we are seeing glimmers of improvement.
Remember, risk variance rises with volatility. The price in time offers significant alpha capture time and again, however, that is countered by the natural defensiveness or skittishness towards conviction when prices are moving. For now, prices have stopped moving and with some of the other improving metrics, trading conditions are better than we’ve seen in some time.
Mid-July starts the earnings period and should go a long way towards settling the corporate expectations argument. The Consumer Price Index, Producer Price Index, Employment Report and FOMC meetings will continue to be the seminal events the market hangs its hat on but be aware – since May 3, 2023 FOMC hike and subsequent signal of a pause, total liquidity in the Liquidnet ATS on a daily basis is up 13% from the prior two month period with the S&P 500 up 7% and the Nasdaq up 12%.
When volatility subsides, three things occur:
Dark trading increases: ATS stats as a percentage of overall market are showing signs of rising.
Average trade size increases: Fear of adverse selection drops and institutions regain control over the market making.
Spreads start to drop: There’s less price risk so market making quoting gets tighter and the cost of trade drops.
Continuous volume is thin but poised to improve. It looks like a gradual move to conviction but when that conviction turns—which we are seeing signs of—there is cash to be put to work.
Written by Jeffrey O’Connor, Head of Equity Market Structure, Americas
The information provided by Liquidnet is for institutional investor use and is intended for the recipient only. Any disclosure, reproduction, distribution or other use of the message or any information generated by the product by an individual or entity other than the intended recipients prohibited. Please contact your Liquidnet coverage for more information about any of the information and analysis provided herein.