
Mid-Year Check-In: Still Uncertain, Just Hotter
Happy summer — and with it, a classic mid-year check-in. So far, if there’s one word that continues to define the year, it’s “uncertainty.” Themes keep shifting, sentiment keeps changing, but uncertainty remains the constant. In some ways, 2025 feels like a continuation of 2022: prolonged periods of high correlation and real price volatility. The big difference? Performance. Still, the core question persists — can this economy hold up? In that sense, things feel familiar. But the real focus now is: how does all of this impact liquidity in the market, especially when it comes to steady institutional volume?
There are three key factors that determine trading cost: volume, liquidity, and spread. It’s not easy to pinpoint which one carries the most weight — they’re deeply interconnected — but continuous institutional volume influences all three. The sharp rise in real price volatility, which kicked in almost exactly with the start of 2025, has triggered a wave of institutional caution. Elevated risk variance, coupled with ongoing macro uncertainty, has negatively impacted all market conditions. As a result, the way liquidity is sourced — and how traders engage with it — has shifted meaningfully.
Intraday volatility has also picked up notably, adding another layer of complexity to market conditions. Looking back, 2022 into 2023 marked the largest cash raise in the past two decades. While cash levels have since normalized (alongside stretched valuations compared to the deep underperformance of 2022), healthier market metrics only began to take hold once the macro environment started to stabilize.
Trading conditions remain challenging, but there are signs of underlying stability returning.
According to Liquidnet Analytics:
Cost to Trade Factor (Top 500 names) is up roughly 30% year-over-year, as shown in the below chart. While some of the spike seen earlier in the year has cooled, elevated cost levels continue to reflect a more cautious and fragmented market.

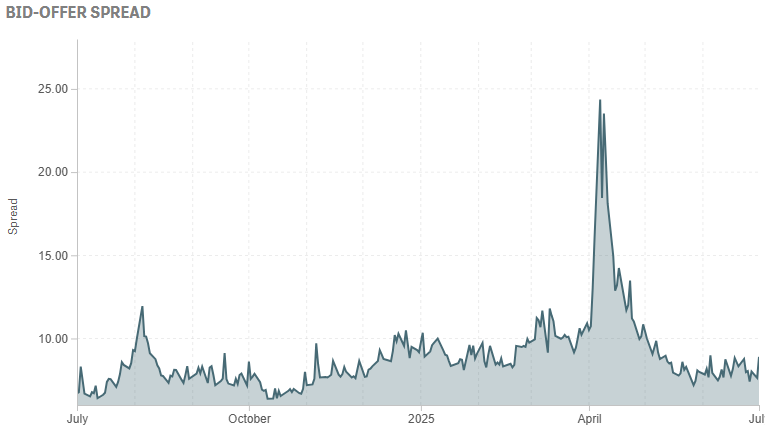
Bid/Offer Spread has climbed about 40% over the same period, illustrated in the below chart. Conditions have improved significantly since the volatile post-Liberation Day stretch, but spreads remain historically wide, pointing to ongoing hesitancy and risk sensitivity in liquidity provision.
Market Depth (Top 500) has dropped nearly 40% since the start of the year, as seen in the chart below, further reinforcing the difficulty in sourcing liquidity — particularly in size — without moving the market.

Trading conditions remain difficult — no surprise there — but there are growing signs of normalization. Despite a steady flow of headlines and heightened geopolitical risk, the market seems to be taking it all in stride. If price is the news, then the message is clear: inflation concerns around tariff implementation may be overstated. We’re seeing a return to a market that’s less reactive to noise and more focused on real data CPI, PCE, jobs numbers, sentiment, and earnings.
Trading’s not getting easier — just smarter
The real story lies in the shift in how liquidity is being sourced. As is typical during periods of volatility and uncertainty, trade sizes are falling, and fast. Traders are increasingly steering clear of blocks, wary of adverse selection. What’s different this time is that the volume isn’t simply migrating to exchanges. Instead, market makers are leaning more heavily on ATS execution — in fact, at the highest rate on record. The PFOF (payment for order flow) feedback loop is running hot, sustaining market maker participation at historically elevated levels.
Retail remains a major force. While we’re not at meme-stock extremes, retail has consistently accounted for over 20% of total volume this year. Even more notable is that retail inflows accelerated in the wake of the Liberation Day volatility spike, while institutions pulled back. That divergence created a sort of passive retail bid, helping stabilize the market and, in many cases, significantly outperform the institutional participants.
Average daily trading volume year-to-date is 16.6 billion shares — up 38% from 2024 and 46% above the five-year average. That’s an unprecedented one-year jump. The pandemic created a lasting structural shift toward off-exchange trading, and this year that trend has intensified. The recent spike in real price volatility hasn’t pushed flow back onto exchanges; instead, small-sized orders are increasingly being filled in ATSs. Market makers are capitalizing on wider spreads, systematic funds are chasing momentum, and retail participation has proven surprisingly resilient. Altogether, total volume is now being driven more by non-traditional contra flow — which looks very different from the lens of a traditional asset manager.
You can see this clearly in the steady decline of ATS average trade size, now further pressured by the lack of appetite for block trading. Blocks remain the best tool to navigate schedule-based risk variance, but they’re getting harder to execute. Buy-side desks are facing fewer like-minded contras and are increasingly forced to make second-by-second execution decisions. The shift in venue preference feels more secular than cyclical.
So far this year, FINRA TRF-reported volumes have accounted for 50% of total consolidated volume, as shown in the chart below — a trend that began at the tail end of 2024. Two things are driving it: (1) the dominance of small-sized liquidity in ATSs, and (2) the unexpected strength of retail as a consistent bid, even during periods of market stress.

Institutional flow is thinning at the top
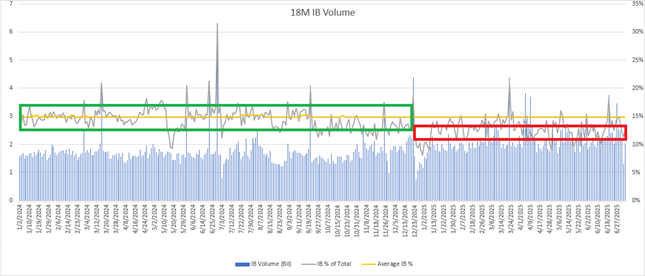
Investment banks still handle the bulk of institutional flow but breaking out the volume they report can be a useful barometer for what’s actually executable within total reported volumes. In that context, the recent step down in bank-reported volume (as a percentage of total volume) is notable. It suggests a thinner layer of truly actionable liquidity beneath the headline numbers — another sign that even as volumes remain elevated, the nature of that flow has shifted meaningfully.
Earnings matter (no, really this time)
As mentioned earlier, there’s been a healthy shift away from obsessive focus on tariff headlines and back toward fundamentals. Earnings season rarely sparks a broad uptick in volume on its own, but it does create opportunities. Portfolio managers often use volatility bands during reporting season to adjust fundamental positions. With major indexes at all-time highs — and the S&P 500 trading around 22x forward earnings — this round of corporate results could help settle at least some of the broader uncertainty.
Equity performance is sending a few clear signals:
Inflation fears may have been overdone
Markets are pricing in rate cuts
Earnings growth is holding up stronger than expected
Every earnings season tends to feel like the most important ever, but with all three of these drivers in question, this one carries some real weight. At the same time, market breadth is narrowing, which is a growing concern. Since the April lows, big tech — particularly the “Mag 7” (Alphabet, Amazon, Apple, Microsoft, Meta, NVIDIA, and Tesla) — has led the charge, rising 36%, compared to a 25% gain in the broader S&P 500. That kind of leadership concentration isn't healthy, especially in a macro environment still full of question marks. It puts added pressure on earnings to confirm or refute whether this narrow leadership can persist. The equal-weighted S&P 500 continuing to lag the cap-weighted index only reinforces that concern.
Another dynamic to watch: correlations are falling fast, particularly in the past few trading days. For most of the year, correlations have stayed elevated, making it a tough environment for fundamental stock pickers. High correlations usually suggest that risk is being pulled from the system — think 2022, when everything traded in lockstep until the macro picture became clearer.
But now, we’re seeing the opposite. As correlations drop, it may be signaling a few things:
Risk appetite is returning.
Macro uncertainty is fading.
Strong earnings could create separation — finally offering fundamental managers the chance to find real alpha again.
The July 9 trade deadline has been a source of tension, with rapidly shifting policy signals over the past week. But the market seems to be digesting it, and the falling correlations could be a sign that investors are ready to look beyond the noise.
Calm waters for now, but storm signals are mixed
The “storm cleanup” from April’s volatility looks to be behind us. This week may be quiet in terms of headline catalysts (beyond today’s FOMC minutes), but things heat up quickly: inflation prints, earnings, jobs reports, and rate decisions are all on deck. We could go from “summer doldrums” to “all-hands-on-deck” in no time.
From the lens of the traditional institutional money manager, conditions are still difficult. But for non-traditional participants, the environment is rich with opportunity. That’s showing up clearly in the secular shifts in liquidity sourcing and the health of those flows. This is the moment for traders to step back, reevaluate the shape of liquidity, and rethink how best to interact with it.
We’re in a lightly positioned, low-liquidity, thin-participation market — and the coming weeks could go a long way toward determining whether the uncertainty lifts or deepens heading into the back half of the year.
Written by Jeffrey O’Connor, Head of Equity Market Structure and Sell Side ATS Strategy, Americas
The information provided by Liquidnet is for institutional investor use and is intended for the recipient only. Any disclosure, reproduction, distribution or other use of the message or any information generated by the product by an individual or entity other than the intended recipients prohibited. Please contact your Liquidnet coverage for more information about any of the information and analysis provided herein.